
Monitoring Resources#
CU Research Computing has two main tools which can help users monitor their HPC resources:
Slurm commands: Slurm provides built-in commands that allow users to retrieve usage summaries, job efficiency data, job history, and priority.
XDMoD: A web portal for viewing metrics at the system, partition, and user-levels.
Monitoring Through Slurm Commands#
You can obtain important usage and efficiency metrics directly through Slurm’s built-in commands and answer questions posed by the subsections below.
How many Service Units (core hours) have I used?#
Type the command name for usage hint:
$ suuser
This will display the output:
Purpose: This function computes the number of Service Units (SUs)
consumed by a specified user over N days.

Usage: suuser [userid] [days, default 30]
Hint: suuser ralphie 15
Check usage for the last 365 days:
$ suuser ralphie 365
This will display the output:
SU used by user ralphie in the last 365 days:
Cluster|Account|Login|Proper Name|Used|Energy|
alpine|admin|ralphie|Ralphie|15987|0|
alpine|ucb-testing|ralphie|Ralphie|3812|0|
alpine|tutorial1|ralphie|Ralphie|3812|0|
alpine|ucb-general|ralphie|Ralphie|5403|0|
This output tells us that:
Ralphie has used “SUs” across four different accounts over the past year
Ralphie’s usage by account varied from 3,812 SUs to 15,987 SUs
Who is using all of the SUs on my groups’ account?#
Type the command name for usage hint:
$ suacct
This will display the output:
Purpose: This function computes the number of Service Units (SUs)
consumed by each user of a specified account over N days.

Usage: suacct [account_name] [days, default 30]
Hint: suacct ucb-general 15
Check admin account usage over past 180 days:
Tip
Most user accounts follow the naming convention ucbXXX_ascX, in this example we show the admin account.
$ suacct admin 180
This will display the output:
SU used by account (allocation) admin in the last 180 days:
Cluster|Account|Login|Proper Name|Used|Energy
alpine|admin|||763240|0
alpine| admin|coke4948|Corey Keasling|84216|0
alpine| admin|frahm|Joel Frahm|24|0
alpine| admin|holtat|Aaron Holt|9832|0
alpine| admin|joan5896|Jonathon Anderson|9357|0
alpine| admin|ralphie|Ralphie|9357|0
This output tells us that:
Five users used the account in the past 180 days.
Their usage ranged from 24 SUs to 84,216 SUs
What jobs have I run over the past few days?#
Type the command name for usage hint:
$ jobstats
This will display the output:
Purpose: This function shows statistics for each job
run by a specified user over N days.

Usage: jobstats [userid] [days, default 5]
Hint: jobstats ralphie 15
Check ralphie’s jobstats for the past 35 days:
$ jobstats ralphie 35
This will display the output:
job stats for user ralphie over past 35 days
jobid        jobname  partition    qos          account      cpus state    start-date-time     elapsed    wait
-------------------------------------------------------------------------------------------------------------------
8483382      sys/dash amilan       normal       ucb-gener+   1    TIMEOUT  2021-09-14T09:32:09 01:00:16   0 hrs
8487254      test.sh  amilan       normal       ucb-gener+   1    COMPLETE 2021-09-14T13:21:12 00:00:02   0 hrs
8487256      interact ahub         interacti+   ucb-gener+   1    TIMEOUT  2021-09-14T13:22:11 12:00:22   0 hrs
8508557      acompile acompile     compile      ucb-gener+   2    COMPLETE 2021-09-16T10:41:45 00:00:00   0 hrs
8508561      test.sh  amilan       normal       ucb-gener+   24   CANCELLE 2021-09-22T10:07:03 00:00:00   143 hrs
8508569      test     amilan       normal       ucb-gener+   4096 FAILED   2021-09-16T10:42:46 00:00:00   0 hrs
8508575      test     amilan       normal       ucb-gener+   8192 FAILED   2021-09-16T10:43:17 00:00:00   0 hrs
8508593      test     amilan       normal       ucb-gener+   4096 CANCELLE 2021-09-16T10:44:47 00:00:00   0 hrs
8508604      test     amilan       normal       ucb-gener+   2048 CANCELLE 2021-09-16T10:45:40 00:00:00   0 hrs
8512083      spawner- ahub         interacti+   ucb-gener+   1    TIMEOUT  2021-09-16T16:55:37 04:00:23   0 hrs
8579077      acompile acompile     compile      ucb-gener+   1    COMPLETE 2021-09-24T15:26:32 00:00:47   0 hrs
8627076      acompile acompile     compile      ucb-gener+   24   CANCELLE 2021-10-04T12:17:30 00:10:03   0 hrs
8672525      interact ahub         interacti+   ucb-gener+   1    CANCELLE 2021-10-08T13:29:13 00:07:25   0 hrs
8800741      interact ahub         interacti+   ucb-gener+   1    CANCELLE 2021-10-19T08:11:44 01:48:38   0 hrs
This output tells us that:
Ralphie has run 14 jobs in the past 35 days
Most jobs had queue waits of < 1 hour
The number of cores requested ranged from 1–>8192
The elapsed times ranged from 0 hours to 1 hour and 48 minutes
What is my priority?#
Important
What is “Priority”?
Your priority is a number between 0.0 –> 1.0 that defines your relative placement in the queue of scheduled jobs
Your priority is computed each time a job is scheduled and reflects the following factors:
Your “Fair Share priority” (the ratio of resources you are allocated versus those you have consumed for a given account)
Your job size (slightly larger jobs have higher priority)
Your time spent in the queue (jobs gain priority the longer they wait)
The partition and qos you choose (this is a minor consideration on CURC systems)
Your “Fair Share” priority has a half life of 14 days (i.e., it recovers fully in ~1 month with zero usage)
The simplest method to determine your priority on the system is to review your fair share priority. This can be done using the levelfs command.
Type the command name for usage hint:
$ levelfs
This will display the output:
Purpose: This function shows the current fair share priority of a specified user and their institution.
A value of 1 indicates actual usage matches expected usage.
A value of < 1 indicates actual usage is more than expected usage.
        (longer than average queue waits)
A value of > 1 indicates actual usage is less than expected usage
        (shorter than average queue waits)
Note: It is possible to have high priority in a given account
      and low priority for your institution as a whole, and vise-versa.
      Both numbers affect your queue wait times.

Usage: levelfs [userid]
Hint: levelfs ralphie
Check Ralphie’s fair share priority:
$ levelfs ralphie
LevelFS for user ralphie and institution ucb:

Account             LevelFS_User        LevelFS_Inst
-----------------------------------------------------
admin               1.016845            1.105260
ucb-general         inf                 1.105260
This output tells me:
Ralphie hasn’t used
ucb-generaland therefore Ralphie has very high (“infinite”) fair share priority.Ralphie has used
adminbut not much. Fair share priority is >> 1 , therefore Ralphie can expect lower-than-average queue waits compared to average ucb-general waits.
How efficient are my jobs?#
Type the command name for usage hint:
$ seff
This will display the output:
Usage: seff [Options] <Jobid>
       Options:
       -h    Help menu
       -v    Version
       -d    Debug mode: display raw Slurm data
Now check the efficiency of job 20522520:
$ seff 20522520
This will display the output:
Job ID: 20522520
Cluster: alpine
User/Group: ralphie/ralphiegrp
State: COMPLETED (exit code 0)
Nodes: 1
Cores per node: 21

──────── CPU Metrics ────────
CPU Utilized: 7-14:11:13
CPU Efficiency: 75.77% of 10-00:27:21 core-walltime
Job Wall-clock time: 11:27:01
Memory Utilized: 21.25 GiB
Memory Efficiency: 27.96% of 76.00 GiB (76.00 GiB/node)

──────── GPU Metrics ────────
Number of GPUs: 1
GPU Type: l40
NOTE: GPU metric availability may vary by GPU type.
      Please refer to our documentation for details: https://curc.readthedocs.io/en/latest/compute/monitoring-resources.html#how-can-i-check-memory-and-gpu-utilization-for-my-jobs
Max GPU Utilization: 41%
Max GPU Memory Utilized: 874.00 MiB
Note
The seff output is divided into two sections: CPU Metrics and GPU Metrics.
CPU Metrics are always shown, regardless of the type of job, and summarize CPU utilization, memory usage, and efficiency.
GPU Metrics are displayed only for jobs that request GPUs. For CPU-only jobs, this section will not appear. The example above is for a GPU job, which is why both CPU and GPU metrics are shown.
This output tells us that:
The 21 CPU cores reserved for this job were ~76% utilized, which is reasonable but slightly below the ideal range (>80%).
The job ran for ~11.5 hours wall-clock time, accumulating ~7.6 days of total CPU time, indicating a long-running workload with sustained CPU usage.
21.25 GiB of RAM was used out of 76.00 GiB reserved (~28%), suggesting the job was not memory-bound and could likely run with a smaller memory request.
One
L40GPU was allocated, but maximum GPU utilization was 41%, with only ~874 MiB of GPU memory used, indicating the GPU was underutilized for much of the run.
See also
Not all GPUs support report memory and utilization metrics in seff output. See “Why am I getting unexpected results for my GPU memory or utilization metrics?” for supported configurations and requirements.
How can I check the efficiency of array jobs?#
Use the seff-array command with the help flag for a usage hint:
$ seff-array -h
This will display the output:
usage: seff-array.py [-h] [-c CLUSTER] [--version] jobid

positional arguments:
  jobid

options:
  -h, --help            show this help message and exit
  -c CLUSTER, --cluster CLUSTER
  --version             show program's version number and exit
In order to check the efficiency of all jobs in job array 14083647, run the command:
$ seff-array 14083647
This will display the status of all jobs in the array:
--------------------------------------------------------
Job Information
ID: 14083647
Name: vecjob_gpu
Cluster: alpine
User/Group: ralphie/ralphiegrp
Requested CPUs: 1 cores on 1 node(s)
Requested Memory: 3.75G
Requested Time: 00:10:00
--------------------------------------------------------
Job Status
COMPLETED: 4
--------------------------------------------------------
--------------------------------------------------------
Finished Job Statistics
(excludes pending, running, and cancelled jobs)
Average CPU Efficiency 19.21%
Average Memory Usage 0.00G
Average Run-time 3.50s
---------------------
Additionally, seff-array will display a histogram of the efficiency statistics all of the jobs in the array, separated into 10% increments. For example:
CPU Efficiency (%)
---------------------
+0.00e+00 - +1.00e+01  [0]
+1.00e+01 - +2.00e+01  [2]  ████████████████████████████████████████
+2.00e+01 - +3.00e+01  [2]  ████████████████████████████████████████
+3.00e+01 - +4.00e+01  [0]
+4.00e+01 - +5.00e+01  [0]
+5.00e+01 - +6.00e+01  [0]
+6.00e+01 - +7.00e+01  [0]
+7.00e+01 - +8.00e+01  [0]
+8.00e+01 - +9.00e+01  [0]
+9.00e+01 - +1.00e+02  [0]
The above indicates that all of the jobs displayed less than 30% CPU efficiency, with the jobs evenly split (2/4) between 10%–20% and 20%–30% efficiency. This information will also be displayed for memory and time efficiency.
See also
If you are not familiar with Job Arrays in SLURM, you can learn more on the “Scaling Up with job Arrays” page.
How can I check memory and GPU utilization for my jobs?#
The sacct command provides detailed accounting information for completed jobs, including CPU, memory, and GPU metrics (e.g., gpumem, gpuutil). To see a list of available options and usage examples, run sacct with the help argument.
$ sacct -h
This will display the output:
sacct [<OPTION>]
     Valid <OPTION> values are:
     -a, --allusers:
                   Display jobs for all users. By default, only the
                   current user's jobs are displayed.  If ran by user root
                   this is the default.
     -A, --accounts:
                   Use this comma separated list of accounts to select jobs
                   to display.  By default, all accounts are selected.
     --array:
                   Expand job arrays. Display array tasks on separate lines
                   instead of consolidating them to a single line.
     -b, --brief:
                   Equivalent to '--format=jobstep,state,error'.
     -B, --batch-script:
                   Print batch script of job.
                   NOTE: AccountingStoreFlags=job_script is required for this
                   NOTE: Requesting specific job(s) with '-j' is required
                         for this.
      .
      .
      .
     -l, --long:
                   Equivalent to specifying
                   '--format=jobid,jobidraw,jobname,partition,maxvmsize,
                             maxvmsizenode,maxvmsizetask,avevmsize,maxrss,
                             maxrssnode,maxrsstask,averss,maxpages,
                             maxpagesnode,maxpagestask,avepages,mincpu,
                             mincpunode,mincputask,avecpu,ntasks,alloccpus,
                             elapsed,state,exitcode,avecpufreq,reqcpufreqmin,
                             reqcpufreqmax,reqcpufreqgov,reqmem,
                             consumedenergy,maxdiskread,maxdiskreadnode,
                             maxdiskreadtask,avediskread,maxdiskwrite,
                             maxdiskwritenode,maxdiskwritetask,avediskwrite,
                             reqtres,alloctres,
                             tresusageinave,tresusageinmax,tresusageinmaxn,
                             tresusageinmaxt,tresusageinmin,tresusageinminn,
                             tresusageinmint,tresusageintot,tresusageoutmax,
                             tresusageoutmaxn,tresusageoutmaxt,
                             tresusageoutave,tresusageouttot
     -n, --noheader:
                   No header will be added to the beginning of output.
                   The default is to print a header.
     --noconvert:
                   Don't convert units from their original type
                   (e.g. 2048M won't be converted to 2G).
     -N, --nodelist:
                   Display jobs that ran on any of these nodes,
                   can be one or more using a ranged string.
     --name:
                   Display jobs that have any of these name(s).
     -o, --format:
                   Comma separated list of fields. (use "--helpformat"
                   for a list of available fields).
     -p, --parsable: output will be '|' delimited with a '|' at the end
     -P, --parsable2: output will be '|' delimited without a '|' at the end
     -q, --qos:
                   Only send data about jobs using these qos.  Default is all.
     -r, --partition:
                   Comma separated list of partitions to select jobs and
                   job steps from. The default is all partitions.
     -s, --state:
                   Select jobs based on their current state or the state
                   they were in during the time period given: running (r),
                   completed (cd), failed (f), timeout (to), resizing (rs),
                   deadline (dl) and node_fail (nf).
     -S, --starttime:
                   Select jobs eligible after this time.  Default is
                   00:00:00 of the current day, unless '-s' is set then
                   the default is 'now'.
     Note, valid start/end time formats are...
                   HH:MM[:SS] [AM|PM]
                   MMDD[YY] or MM/DD[/YY] or MM.DD[.YY]
                   MM/DD[/YY]-HH:MM[:SS]
                   YYYY-MM-DD[THH:MM[:SS]]
                   now[{+|-}count[seconds(default)|minutes|hours|days|weeks]]
To view the maximum GPU resource usage for a job, the command is:
$ sacct -j <jobid> -pno JobID,TRESUsageInMax
Arguments and Options:
Arguments |
Description |
|---|---|
|
Specifies the Slurm job ID you want information about. Here |
|
Parsable; output will be delimited with a ‘|’ at the end |
|
Removes the header row from the output. |
|
Chooses the output field(s). Here, you’re requesting to display the JobID and maximum resource usage. |
In order to check the metrics for job 18194943, run:
$ sacct -j 18194943 -pno JobID,TRESUsageInMax
This will display the output:
--------------------------------------------------------
18194943||
18194943.batch|cpu=00:56:24,energy=0,fs/disk=350130624578,gres/gpumem=38888M,gres/gpuutil=100,mem=10372780K,pages=3465,vmem=10194376K|
18194943.extern|cpu=00:00:00,energy=0,fs/disk=5273,gres/gpumem=0,gres/gpuutil=0,mem=256K,pages=0,vmem=0|
--------------------------------------------------------
This tells us:
Variable |
Description |
|---|---|
|
Total CPU time consumed (hours:minutes:seconds). |
|
Energy consumed by the job in arbitrary units (often 0 for systems without energy accounting). |
|
Amount of disk I/O performed by the job (in bytes). |
|
Max GPU memory usage. |
|
Max GPU utilization as a percentage. |
|
RAM used by the job. |
|
Number of memory pages used. Typically for advanced monitoring; can often be ignored. |
|
Virtual memory used by the job. Includes RAM + swap + memory-mapped files. |
Note
The sacct command may display multiple entries for a single job, depending on how it was submitted and its job structure:
.batchstep: Appears for jobs submitted viasbatchand reflects the actual workload of the batch script. This is typically the most relevant entry for CPU, memory, and GPU usage..externstep: A lightweight Slurm setup step that usually shows minimal resource usage.Other job steps or tasks: Jobs submitted via
acompile,srun, or as part of job arrays may not have a.batchentry, and each step/task may appear separately.
When reviewing resource usage, users should generally focus on the steps that correspond to their actual workload, rather than relying on all entries indiscriminately.
Similarly, to view the average GPU resource usage for a job
$ sacct -j <jobid> -pno JobID,TRESUsageInAve --noconvert
Arguments and Options:
Arguments |
Description |
|---|---|
|
Filters the report to only show information for the specified job ID. |
|
Parsable; output will be delimited with a ‘|’ at the end |
|
Removes the header row from the output. |
|
Chooses the output field(s). Here, you’re requesting to display the JobID and average resource usage. |
|
Prevents conversion of the units (e.g., MB → GB), ensuring raw data remains unchanged. |
In order to check average GPU metrics for job 18194943, run:
$ sacct -j 18194943 -pno JobID,TRESUsageInAve --noconvert
This will display the output:
--------------------------------------------------------
18194943||
18194943.batch|cpu=00:56:24,energy=0,fs/disk=350130624578,gres/gpumem=40777023488,gres/gpuutil=100,mem=10621726720,pages=3465,vmem=10439041024|
18194943.extern|cpu=00:00:00,energy=0,fs/disk=5273,gres/gpumem=0,gres/gpuutil=0,mem=262144,pages=0,vmem=0|
--------------------------------------------------------
This output contains the same fields as in the TRESUsageInMax example, but here they represent average usage instead of max usage.
See also
If GPU memory or utilization values appear as zero or infinite, your job may be running on unsupported hardware. Refer to “Why am I getting unexpected results for my GPU memory or utilization metrics?” for details on supported GPUs, CUDA requirements, and known limitations.
XDMoD#
XDMoD is a web portal for viewing metrics at the system-, partition- and user-levels.
Would you like to know average queue wait times? Do you need to better understand your historical resource utilization or utilization of your project account by user? The XDMoD (XD Metrics on Demand) web-based tool provides users with the ability to easily obtain detailed metrics for High-Performance Computing resources. This open-source tool was developed by the University at Buffalo Center for Computational Research (CCR). CU Boulder Research Computing runs its own instance, CURC XDMoD that enables users to query metrics for the RMACC, Alpine and Blanca computing resources.
Getting started with XDMoD
All CURC users have access to XDMoD (CU Boulder, CSU and RMACC). At this time, login is only supported for CU Boulder users. Non-CU Boulder users may still query all of the statistics available to CU Boulder users, they just won’t have the ability to personalize metrics.
Step 1: Navigate to the CURC XDMoD instance#
In your browser navigate to https://xdmod.rc.colorado.edu. Upon reaching there you will see a summary screen similar to the following image.
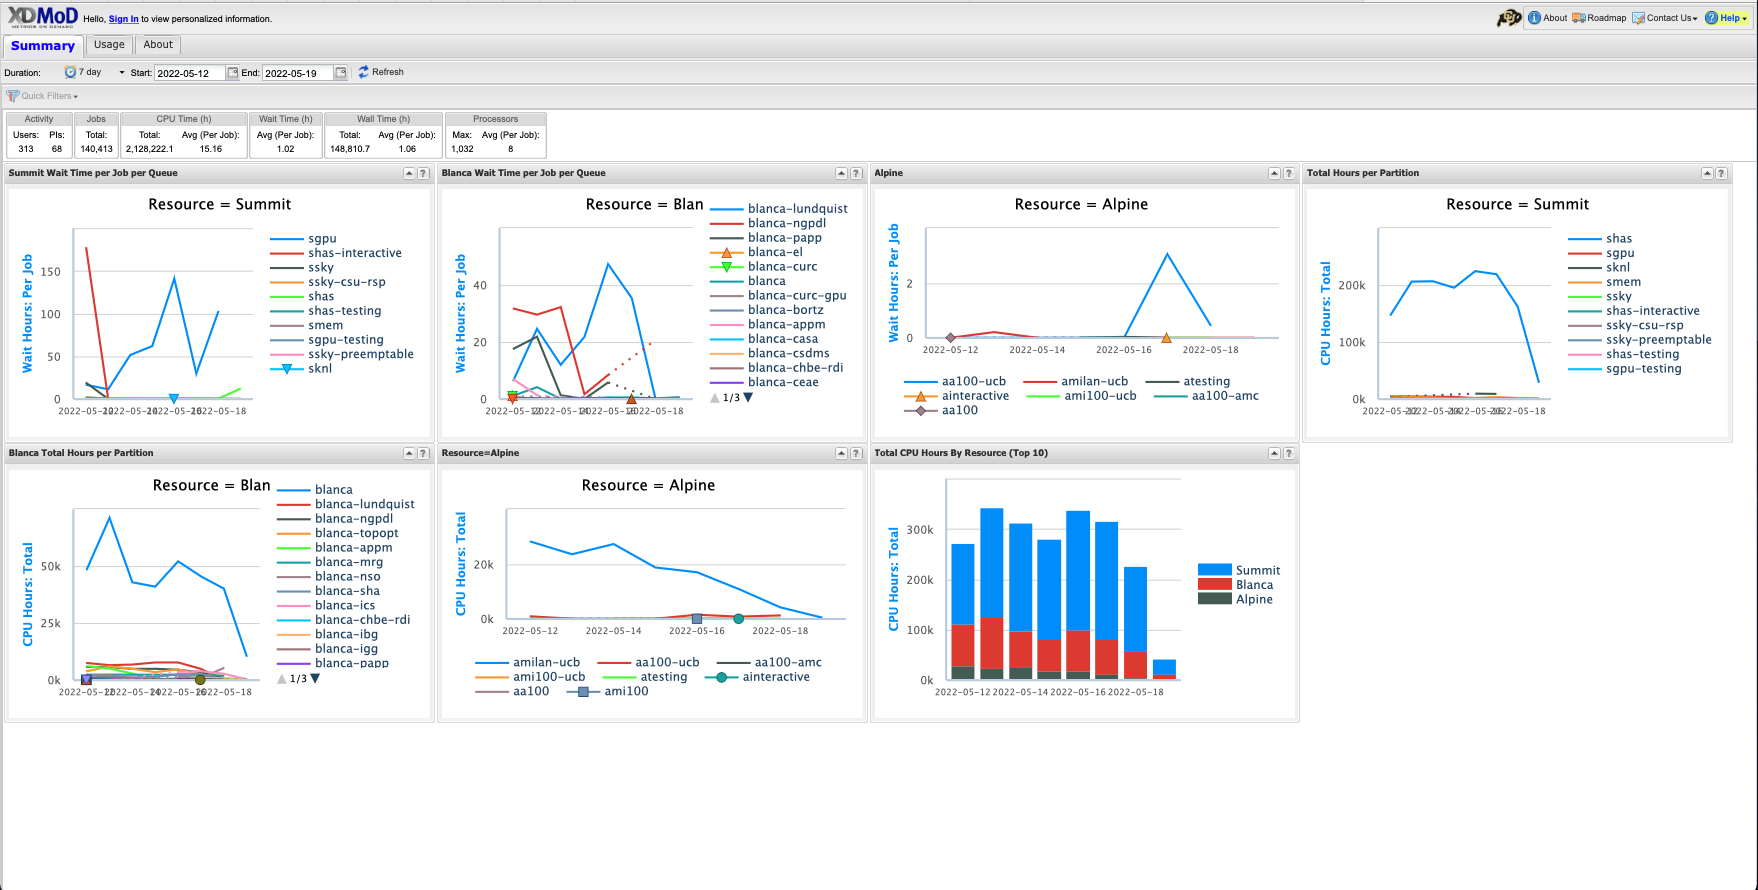
This screen provides some “quick stats” and summary plots that address some of the most common user questions, such as average wait times and recent resource usage by system (Alpine or Blanca) and partition. These metrics may be all you need. If you want to personalize metrics you can login with your CURC username and password (currently only supported for CU Boulder users).
Step 2: Login (CU Boulder users only)#
Choose the Sign In option near the upper left of the screen. This will initiate a pop-up window that gives you the option to “Sign in with CU Boulder Research Computing” or “Sign in with a local XDMoD account”.
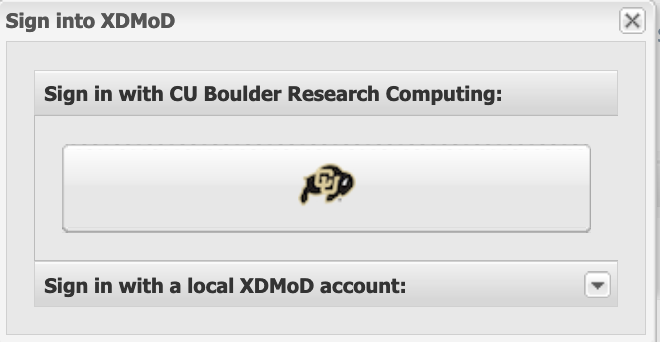
Choose the option for “Sign in with CU Boulder Research Computing” and enter your CURC username and password. The portal uses 2-factor authentication, so you will need to accept the Duo push to your phone to complete login.
Step 3: Familiarize yourself with XDMoD#
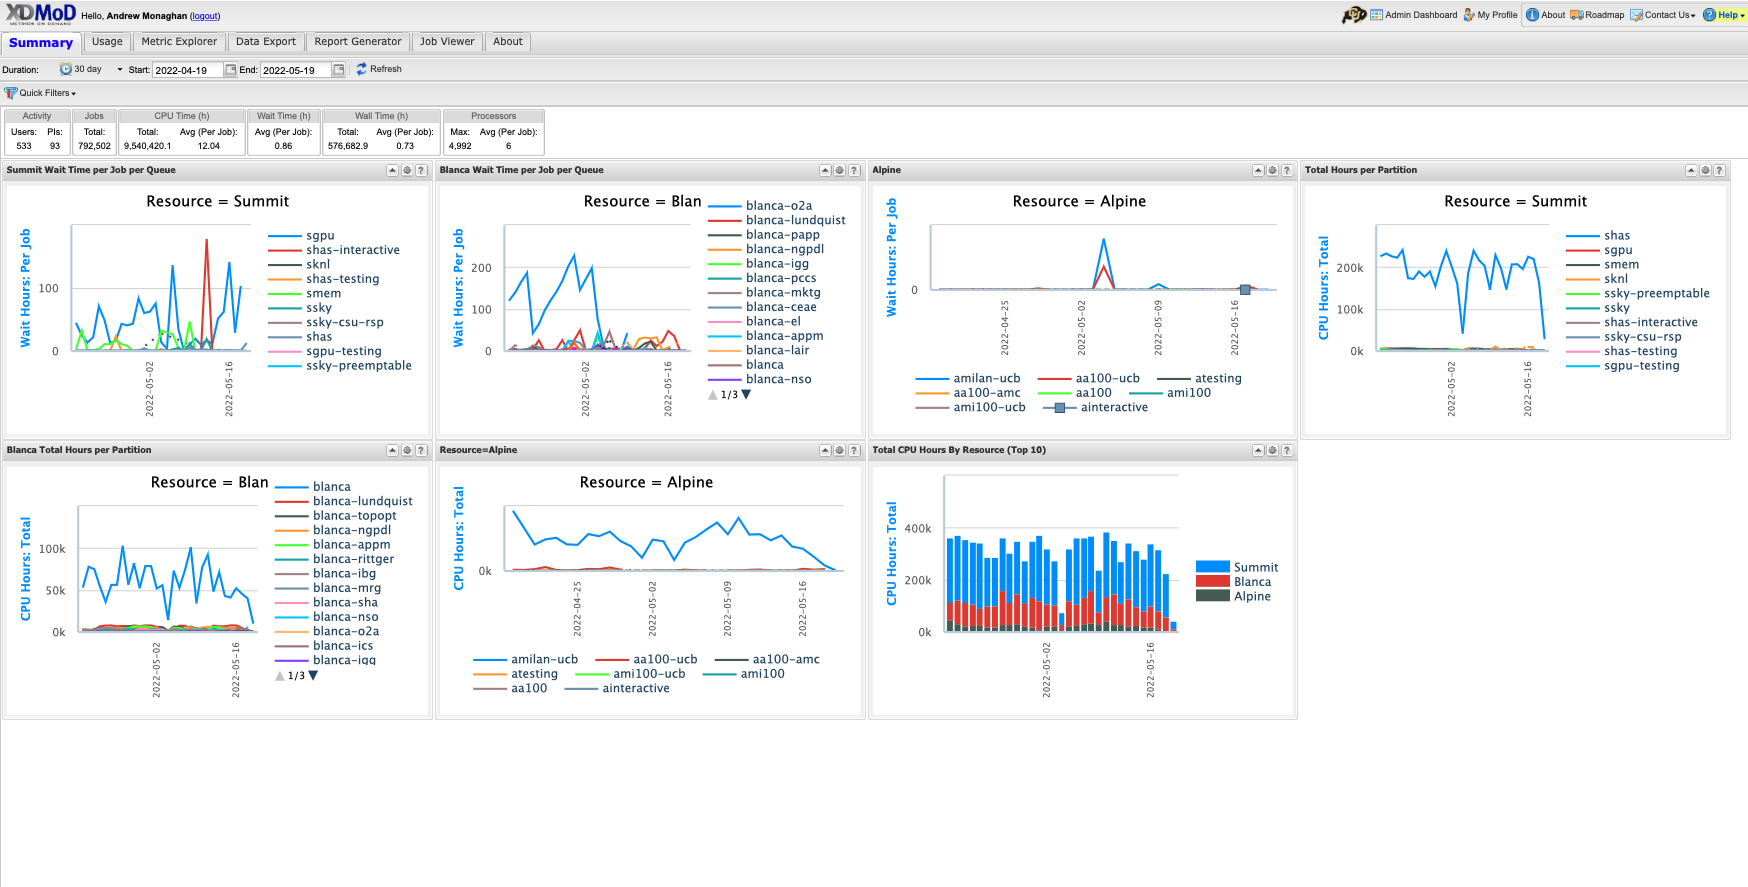
Whether or not you login, you’ll start on the “Summary” screen.
The following tabs will be available, depending on whether you are logged in
Summary (the screen you are on when you login)
Usage (provides access to an expansive set of resource-wide metrics)
Metrics Explorer** (similar to the Usage tab, but with additional functionality)
Data Export** (enables raw data to be output in csv or json format for use in other apps)
Report Generator** (facilitates the creation of reports that can be saved and shared)
Job Viewer** (enables users to search for and view jobs that meet specified criteria)
About (provide general information on the XDMoD software)
** - only available to users who are logged in.
Important
XDMoD Syntax
A “CPU Hour” is a “core hour” (e.g., for a single job, this would be the number of
ntasksa user specifies in their job script multiplied by how long the job runs)A “PI” is a project account (e.g.,
ucb-generalorucb124_asc1)
Step 4: Become a pro!#
XDMoD can query a seemingly endless number of metrics, more than could ever be described in this documentation. To learn how to query specific metrics, customize your views, etc., please refer to the XDMoD documentation.
Example use case#
Let’s say you want to see how many core hours your project account has used over time, including the usage by user.
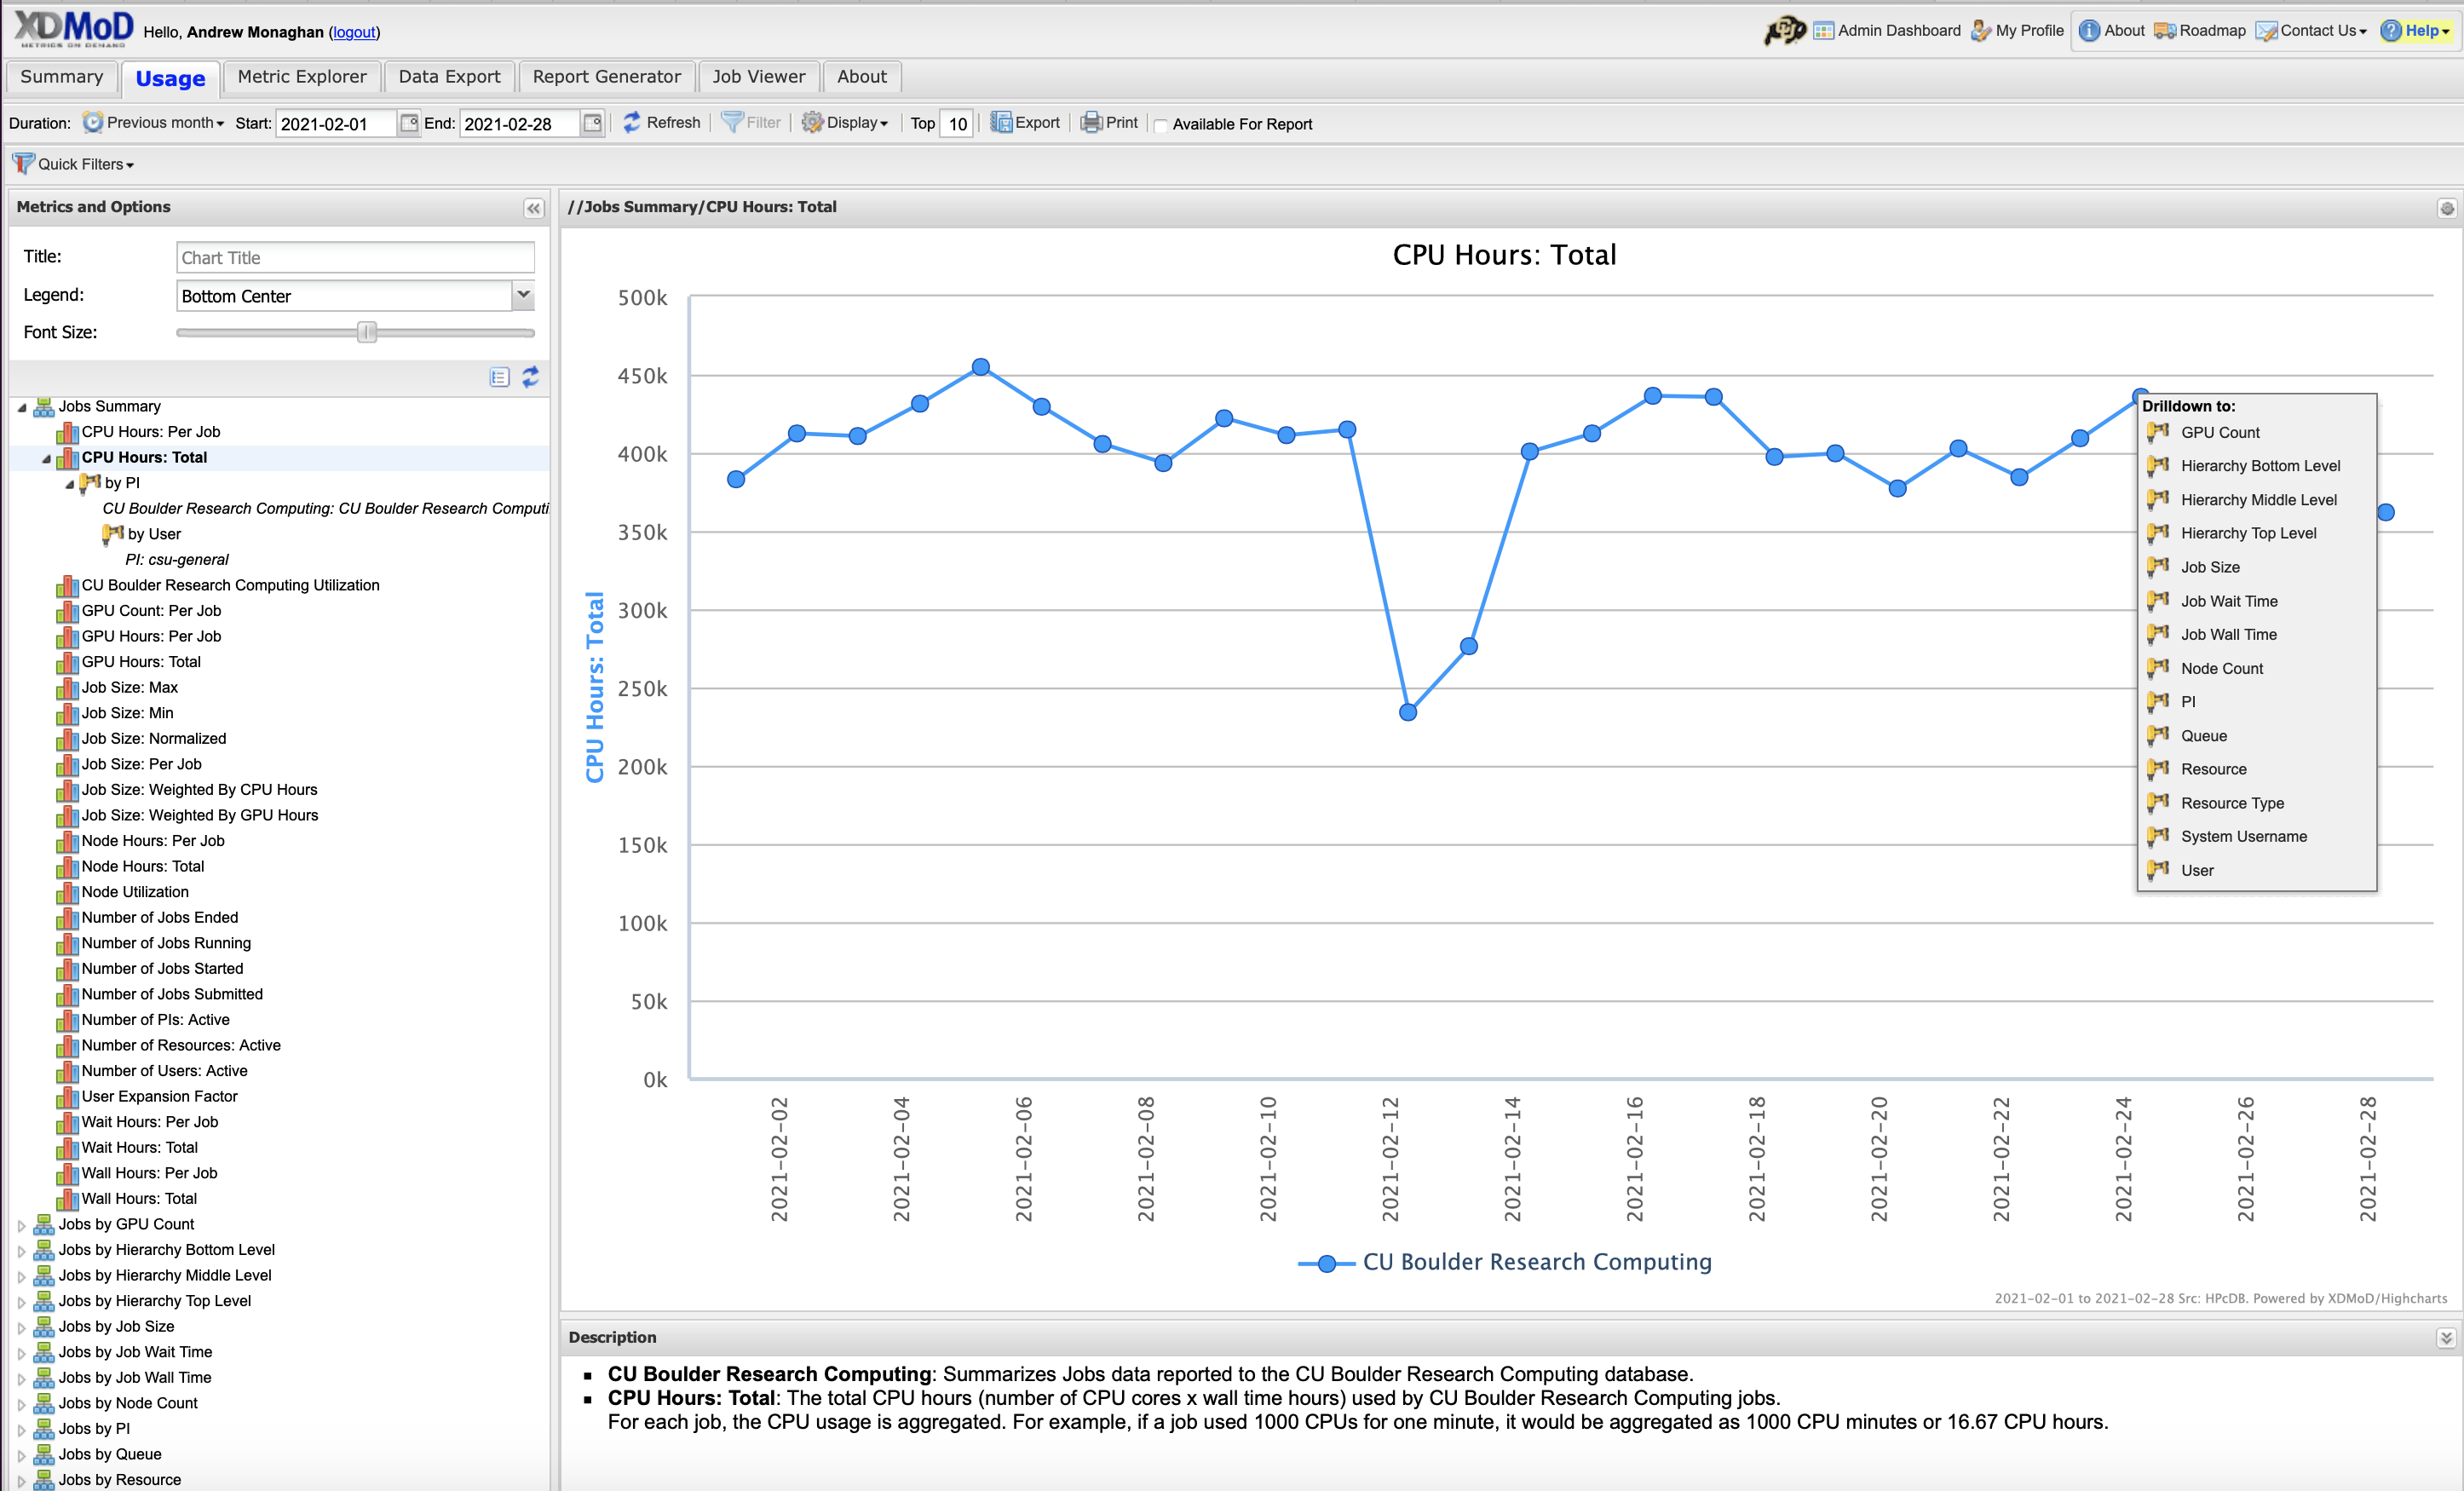
Go to the Usage tab.
In the “Metrics and Options” menu, choose CPU Hours: Total to create a graph of total CPU hours consumed over a default period. In XDMoD syntax a “CPU Hour” refers to a “core hour” (for a single job, this would be the number of
ntasksa user chooses in their job script multiplied by how long the job runs).Click anywhere on the blue line in the graph to expose the “Drill Down” menu:
Choose the “PI” option. In XDMoD syntax a “PI” is a project account (e.g.,
ucb-generalorucb124_asc1).This will revise the graph to show CPU usage for different “PIs” (accounts), showing only the accounts with the greatest usage. Your account may not be shown. To find it click the Filter tab at the top and search for your project (e.g.,
ucb-general).You will now see a graph showing only core hours used by your account. To see core hours used for each user of the account, click anywhere on the line to expose the “Drill Down” menu and choose the User option.
This will revise the graph to show CPU usage by user. If you don’t see your user of interest, you can use the Filter tab at the top to find them.
You can change the time range of the x-axis by specifying the dates in the “Start” and “End” boxes near the top of the screen.